SEO Visibility Checker: How to Read Your Results
Learn how an SEO visibility checker measures impressions, clicks, and average position, and how to track changes over time without misreading the data.
Most advice says to watch one visibility score and treat a rise as proof the site is winning. That advice breaks the moment two reports use different counting rules. A blended rank can look healthy while clicks fall, a property total can look stronger than any single URL, and an indexed page can still be absent from results.
An SEO visibility checker is worth using when it keeps impressions, clicks, click-through rate, and average position apart. It misleads when it blends those counts, mixes property totals with page totals, or treats index status as proof of search exposure. The job is to read the numbers with the counting rule written beside them.
Table of Contents
- The Four Metrics a Visibility Checker Reports
- How to Run a Visibility Check Step by Step
- Why Property and Page Numbers Disagree
- Telling Index Status Apart From Search Visibility
- Tracking Visibility Changes Over Time
- Run Your First Visibility Review This Week
The Four Metrics a Visibility Checker Reports
One rank is the usual stand-in for visibility. It cannot show whether more people had a chance to see a link, or whether anyone chose it.
Google's performance report documentation separates four counts. An impression is a display of a link to a site in Search. A click happens when a user selects that link. Click-through rate is clicks divided by impressions. Average position is the average position of the topmost result from the site across impressions, not the position of every result the site has on the page.
What each count can and cannot show
An impression is not a guaranteed human view. The link was displayed, or it could have been seen, depending on the result type and whether scrolling was required. A click is stricter. It counts only a selection of that link. CTR is the share of displays that turned into selections, so a page with many impressions and few clicks shows a low rate even when its position looks strong.
Average position averages the topmost spot the site held on each impression. It is not a fixed rank for every page and every query. A site can gain visibility through more impressions without receiving more clicks. A page can hold a strong average position and still attract a low CTR, which usually means the title, the snippet, or a result sitting above the link is winning the choice.
| Metric | What It Counts | How It Is Calculated | Common Misreading |
|---|---|---|---|
| Impressions | Times a link to the site appeared in Search | Counted each time the link is displayed | Treated as guaranteed human views |
| Clicks | Times a user selected the link | Counted each time the link is selected | Compared without impressions |
| Click-through rate | Share of impressions that led to a click | Clicks divided by impressions | Read as a ranking score |
| Average position | Position of the topmost result per impression | Averaged across all impressions | Read as the rank for every page and keyword |
A checker that reports these four numbers separately gives a clearer picture than one blended score. Exposure and response are different outcomes, and a single figure forces them into the same bucket. A free AI visibility checker can add a public-page read beside Search Console, but it still cannot replace these four counts.
Pick one query. Read its impressions, clicks, CTR, and average position, then write one sentence that names what moved and what stayed flat.
How to Run a Visibility Check Step by Step
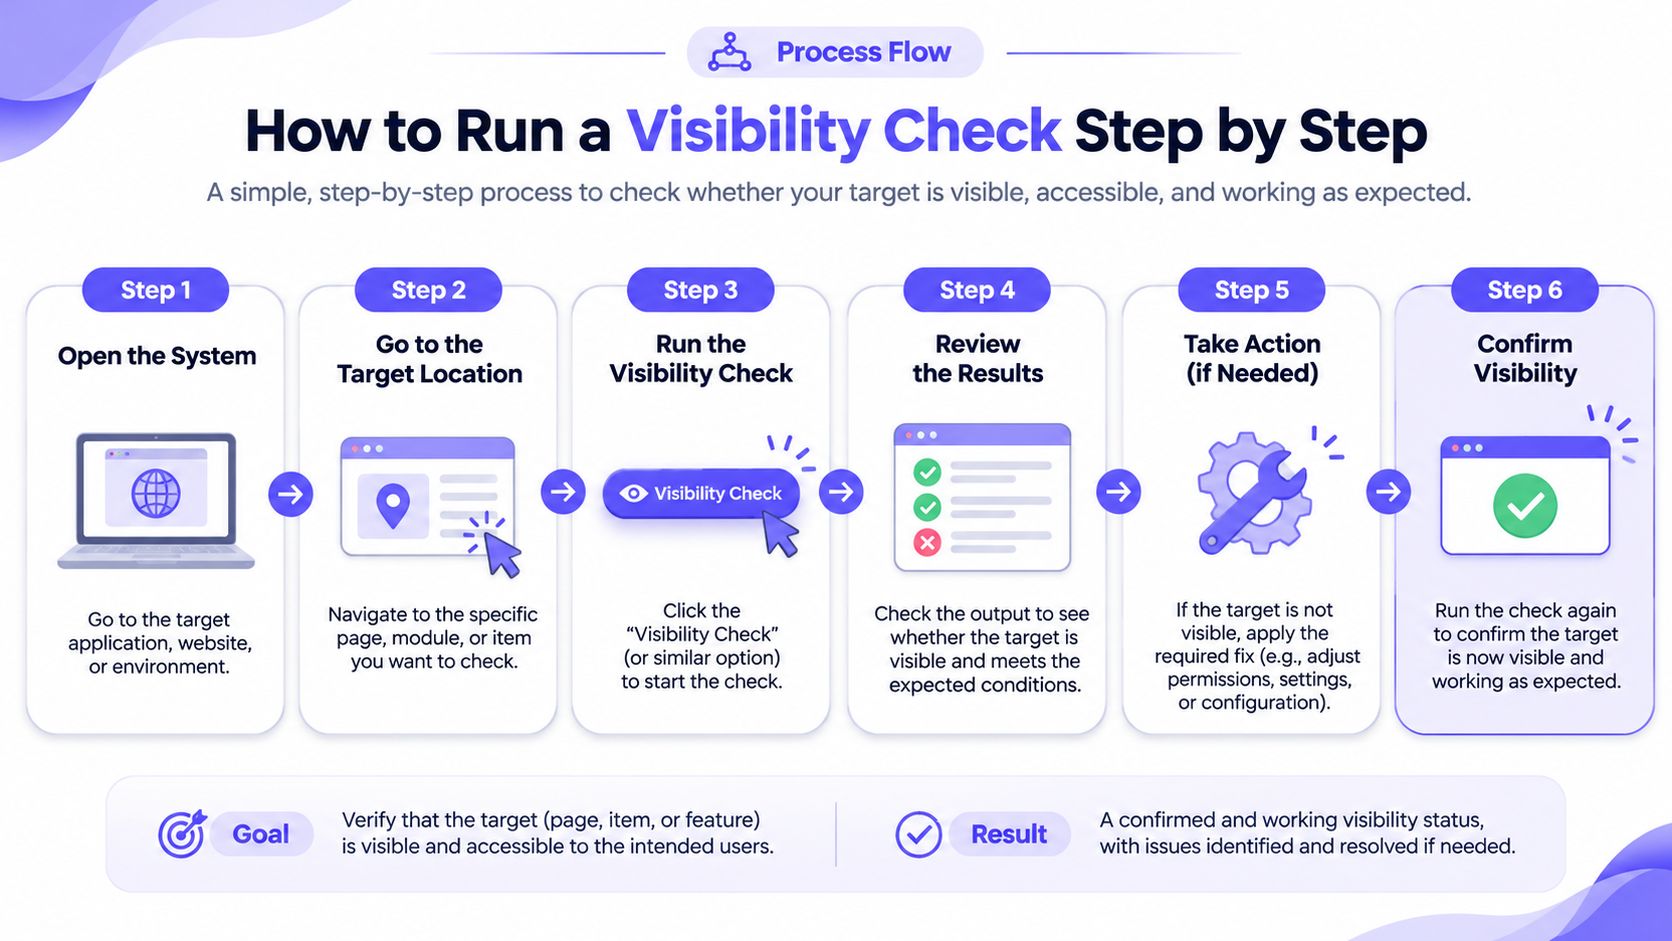
A clean check is a repeatable window, not a one-day snapshot. Google's performance data deep dive frames the practical window as at least 28 to 90 days, with segments kept separate before any average is taken. Shorter ranges swing with ordinary weekly traffic and make a normal dip look like a failure.
The sequence and the usual slip
- Connect a verified site property. Owner data is the baseline. The slip is pasting a public estimate and treating it as the same thing as Search Console.
- Pull 28 to 90 days. A month or a quarter absorbs weekday noise. The slip is judging a site from the last seven days after a holiday or a sale.
- Segment before you average. Break the export by query, landing page, country, device, date, and search appearance. The slip is one average across mobile and desktop, or across two countries, which hides a real drop in one slice.
- Split branded from non-branded queries. Brand searches inflate position and CTR and can hide weak discovery. The slip is celebrating a stronger average that came only from the brand name.
- Weight groups by impressions or business value. A query with a handful of impressions should not count the same as the query that drives most of the displays. The slip is an unweighted mean of every keyword in the table.
- Compare equal periods. Match four weeks to four weeks, or a quarter to the same quarter. The slip is setting a week against a month and calling the gap a trend.
- Annotate the timeline. Mark releases, migrations, and known algorithm changes on the same dates as the chart. The slip is acting on a spike before checking whether a deploy or a template change landed that day.
What a stable baseline looks like
A usable baseline shows similar weekly impressions and a CTR that does not lurch from week to week, with annotations explaining the spikes. Property totals and page totals should both be saved, and the level should be written on the export. Third-party checkers model traffic from keyword databases and click assumptions, so treat those figures as comparative signals, not as a visit count from analytics.
Guides such as this roundup of AI tools for SEO help when the next step is content or technical work. They do not change the counting rules in the export. If row-level sums already disagree with the headline totals, keep the headline totals for the score and use the rows only to find which queries moved.
Practical rule: Do not average across a segment you have not named. Country, device, brand, and date each change the number.
Why Property and Page Numbers Disagree
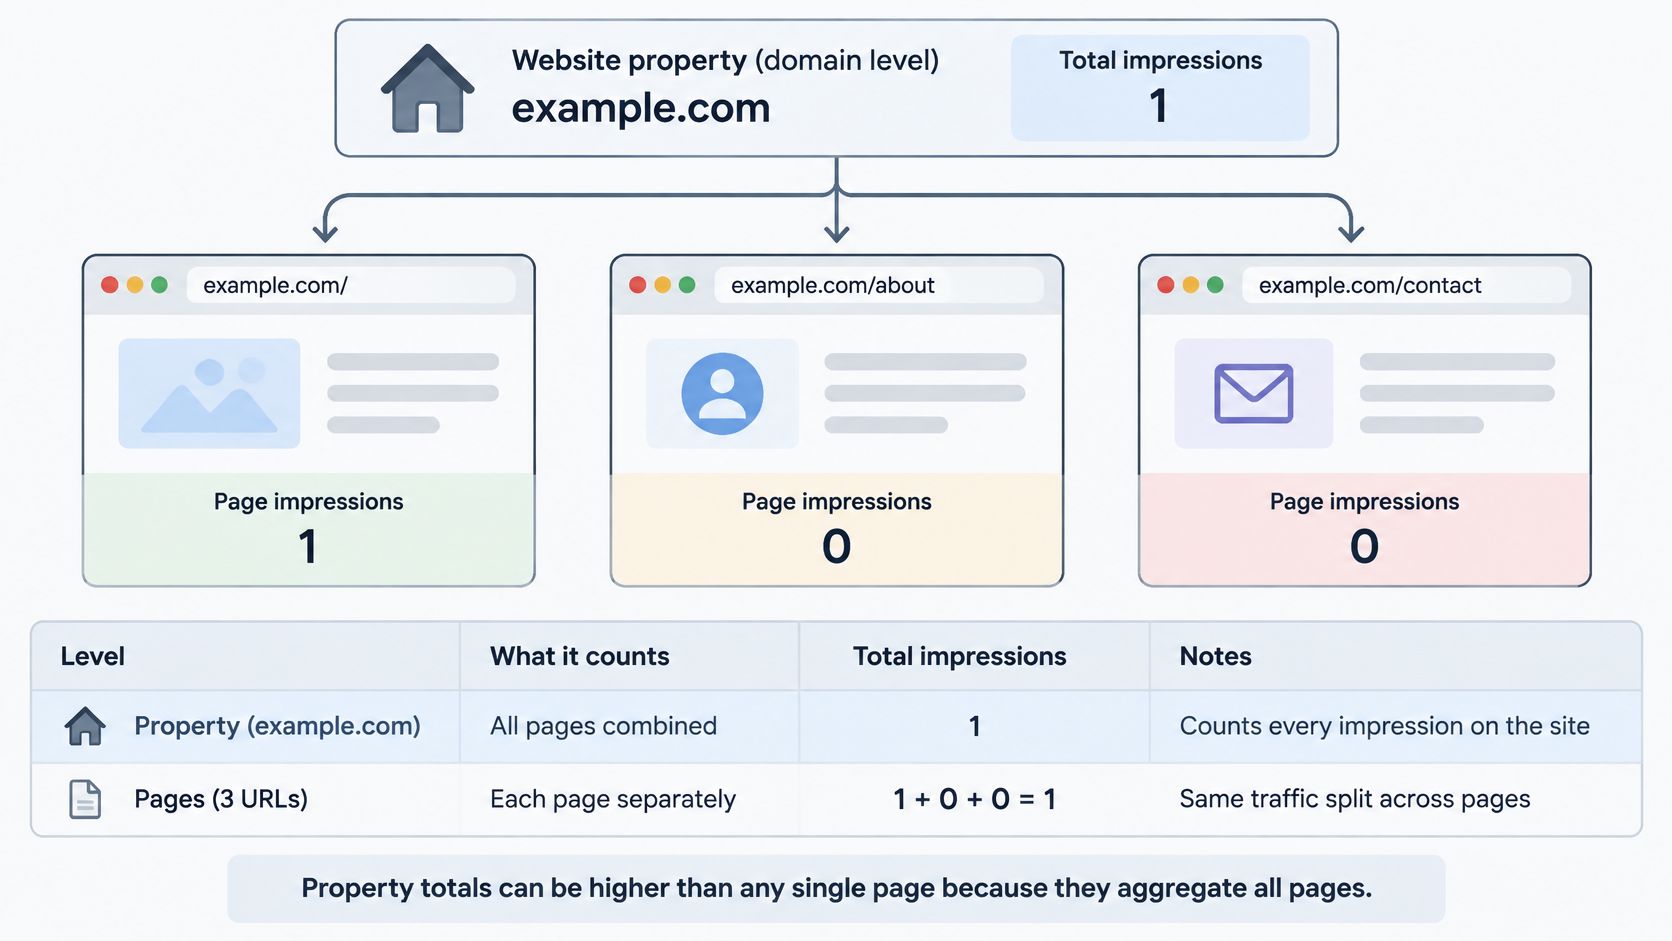
The same three URLs can produce two honest reports that do not match. Google's Search Console counting notes use that case. When several pages from one site appear for a query, property-level reporting counts the property once and records its highest position. Page-level reporting treats each unique URL on its own.
| Level | How the three URLs are counted | CTR | Average position |
|---|---|---|---|
| Property | One impression, topmost position kept | 100% | 1 |
| Each page | Each URL counted separately | 33% | 2 |
In that example, property reporting shows a CTR of 100% and an average position of 1. Page reporting assigns each URL a 33% CTR and an average position of 2. Nothing about the pages changed. Only the grouping changed.
Two errors this creates
A checker that mixes levels makes the property numbers look stronger than the page numbers. Someone comparing a domain report with a URL report may think performance dropped when the counting rule changed. The second error is quieter. Two tools can both say "average position" and still group by domain, property, page, or keyword. Those figures are not interchangeable.
Check the grouping before comparing sites or pages. The property view answers how much demand the site captured on a query, because it keeps the topmost result and counts the impression once. The page view answers which URL needs work, because it spreads clicks and positions across the URLs that appeared. Keep both views, and write the level beside every number you share.
Average position is still an average across impressions. Mixed devices, countries, and result types can move it even when no single ranking changed. Segment first, then average. A checker that will not say whether its CTR and position are grouped by property or by page is not ready for a comparison.
Telling Index Status Apart From Search Visibility
Indexed and visible answer different questions. Google's SEO starter guide says crawlers explore the web to find pages for the index, and it points to a basic check. Pages returned for a site search are in Google's index. The URL Inspection tool in Search Console shows how Google sees one page. Neither check proves the page appeared in results or drew a visit.
Impressions show display in results. Clicks show selections. A checker that presents index presence as proof of ranking visibility or traffic is overstating what it measured. A large index can still hold pages that almost never appear for a query anyone types.
Match the symptom to the next check
| Symptom | Likely Cause | Next Check |
|---|---|---|
| Page missing from site search | Page not indexed or blocked | Inspect the URL in Search Console |
| Impressions rising, clicks flat | Lower CTR or a new result type above the link | Compare CTR by query and search appearance |
| Position stable, clicks falling | Search features or AI summaries above the result | Review the search appearance segment |
| Row sums differ from report totals | Privacy filtering or row limits on report tables | Use report totals for headline numbers |
A missing site-search result points at indexing or a block, so inspect that URL before rewriting the page. Rising impressions with flat clicks point at the choice, not at discovery, so compare CTR by query and by search appearance. A steady position with falling clicks points at features sitting above the organic link. Review that segment before you assume the rank slipped.
When the rows do not add up to the report totals, the table is incomplete. Use the headline totals for the site-level read and the rows only to diagnose queries you can see. A practical website visibility checker walkthrough belongs after those checks, not instead of them.
Index status says Google has the page. It does not say anyone was shown the page.
Tracking Visibility Changes Over Time
Rank-only alerts fail in a specific way. A page can keep a steady average position while clicks fall, so the alert never fires. Watch impressions and clicks, and treat position as context rather than the trigger.
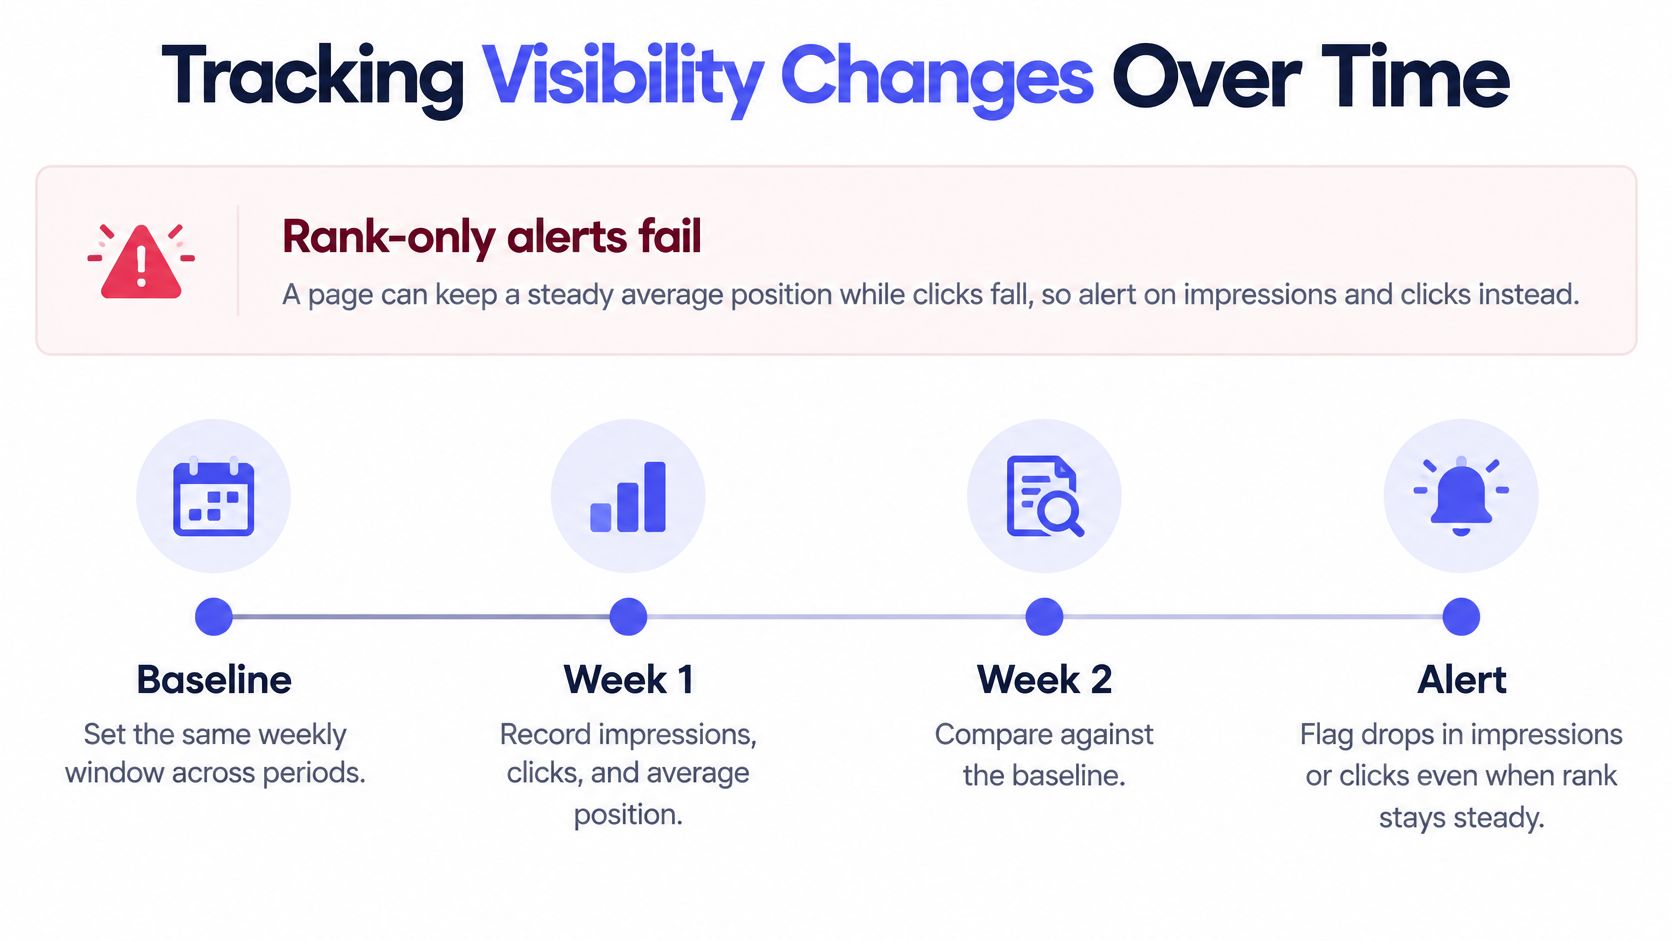
Set the baseline from the same weekly window across several weeks. Each comparison then uses equal periods. Run the check weekly and alert on sustained moves, not on a single-day swing. Put releases, migrations, and known algorithm changes on that same timeline, and read the annotation before you change a title or a template.
Sampled rows and AI answers
Search Console is a strong source and an incomplete census. Google's data anomalies guidance notes that most reports use a representative sample of URLs, omit some low-volume or sensitive queries, store only top data rows, and limit tables to 1,000 rows. Summing the visible query rows undercounts long-tail exposure. Take headline metrics from the report totals. Use rows for diagnosis, and show a coverage warning when the two diverge. Weekly checks on impressions and clicks catch losses that a stable average position will miss.
Generative answers add another gap. One generated answer can include a brand and the next run can omit it, so a single prompt is a weak sample. Repeat the measurement before you treat a mention as durable performance. Fortune's report on Pew data from 900 U.S. adults found users clicked a traditional result on 8% of searches that displayed an AI summary, compared with 15% when no summary appeared, and only 1% clicked a link inside the summary. Exposure in an AI answer does not automatically replace a lost organic click. Tie each number to a goal, whether that is awareness, referral visits, or revenue. A visibility figure on its own does not say which of those moved.
Run Your First Visibility Review This Week
Start with one site and one window of 28 to 90 days. Choose three queries, one branded and two non-branded. For each query, record impressions, clicks, CTR, and average position at property level and at page level. Mark any change on the timeline with its annotation.
Then pick one action. If a page has high impressions and a low CTR, revise the title and snippet. If the page is missing from site search, or URL inspection shows a gap, use the symptom table and check the page before you rewrite it. AI Tool Seekers offers four free tools for this kind of prep: an AI readiness checker, an AI tool finder, an AI cost calculator, and an AI visibility checker. Workflow helpers such as The SEO Agent can organize the follow-up tasks once the numbers point at a page. Before you choose any checker, confirm its current features, plans, and prices on the vendor's site. No checker guarantees rankings, traffic, or citations. Use the numbers to guide the decision, not to replace it.
AI Tool Seekers is a hand-verified directory for comparing AI software, including tools used in SEO and search readiness work. Listings show pricing, limits, and an Editor's Score so you can judge a checker before you trust its export. Visit AI Tool Seekers to browse the directory and run the free visibility checker against a public URL.